Tests
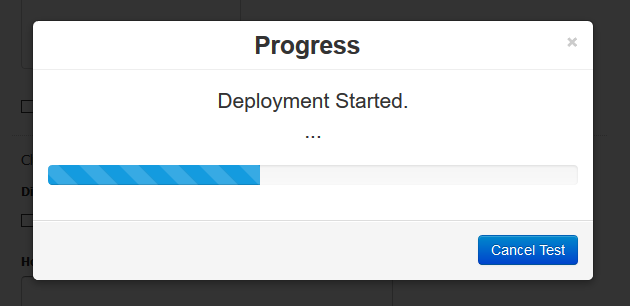
Once you hit the “Test” button you can go watch some movies. It’s take a time depend on your HW. For me it was couple of hours.
- It starts with VM deployment
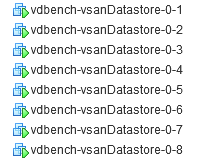
- It will create bunch of VM’s (each 4vCPU, 4GB of RAM, 9xHDD (total 250GB))
Testing was done by using Vdbench VM with input argument “-fvdb-8vmdk-100ws-4k-70rdpct-100randompct-8threads”
Results
Tested VSAN configuration:
- 4x Node configuration with 10gigabit connection
- VC build: VMware vCenter Server 6.5.0 build-7515524
Each ESXi host:
- Build: VMware ESXi 6.5.0 build-7388607
- CPU: Intel(R) Xeon(R) Silver 4114 CPU @ 2.20GHz ( Packages: 2, Cores: 20 )
- Memory: 256 GB
- Server vendor/model: Dell Inc. PowerEdge FC640
-
VSAN Disks:
-
SSD: Local TOSHIBA Disk (naa.58ce38ee2000c0ad)
- TOSHIBA PX05SMB080Y
- 800 GB
- TOSHIBA PX05SMB080Y
-
SSD: Local TOSHIBA Disk (naa.58ce38e06c8a274d)
- TOSHIBA PX05SRB192Y
- 1920 GB
- TOSHIBA PX05SRB192Y
-
SSD: Local TOSHIBA Disk (naa.58ce38e06c8a26fd)
- TOSHIBA PX05SRB192Y
- 1920 GB
- TOSHIBA PX05SRB192Y
-
SSD: Local TOSHIBA Disk (naa.50000397cc89cd79)
- TOSHIBA PX05SMB080Y
- 800 GB
- TOSHIBA PX05SMB080Y
-
-
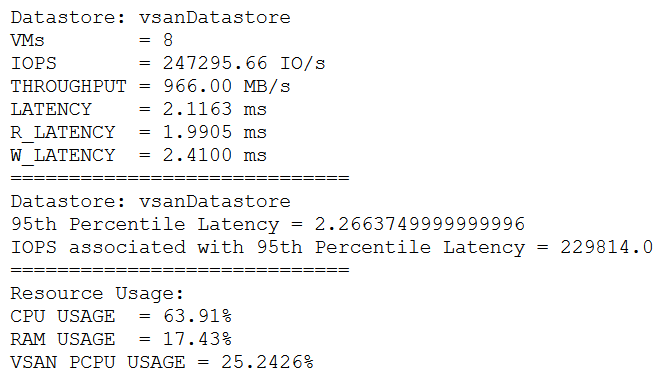
After Vdbench testing is finished, the results are collected from all VM’s. And you can view the result at
- In the .TXT file is summary results
-
Or you can download your result in zip file from
In this saved .zip file are also the graphs with more details. Same what you can see on web http://<YOUR_BENCHMARK2_IP>:8080/results/
Graphs
Just few of them..
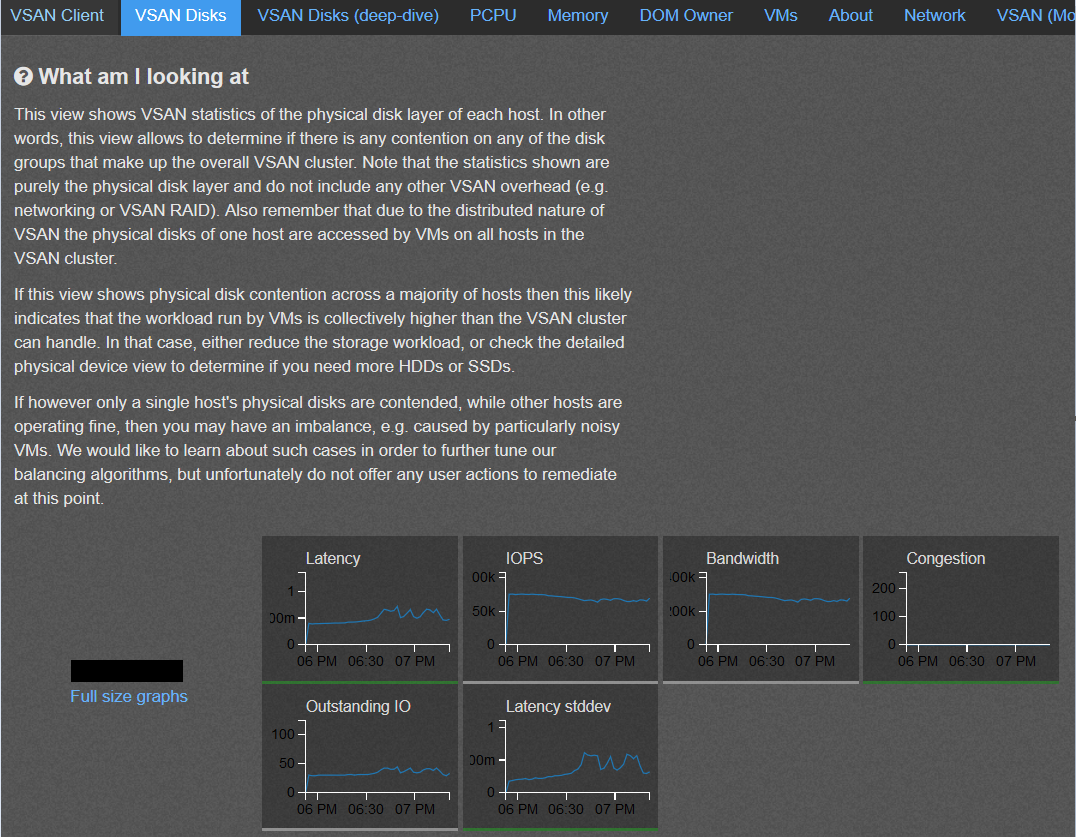
Per disk
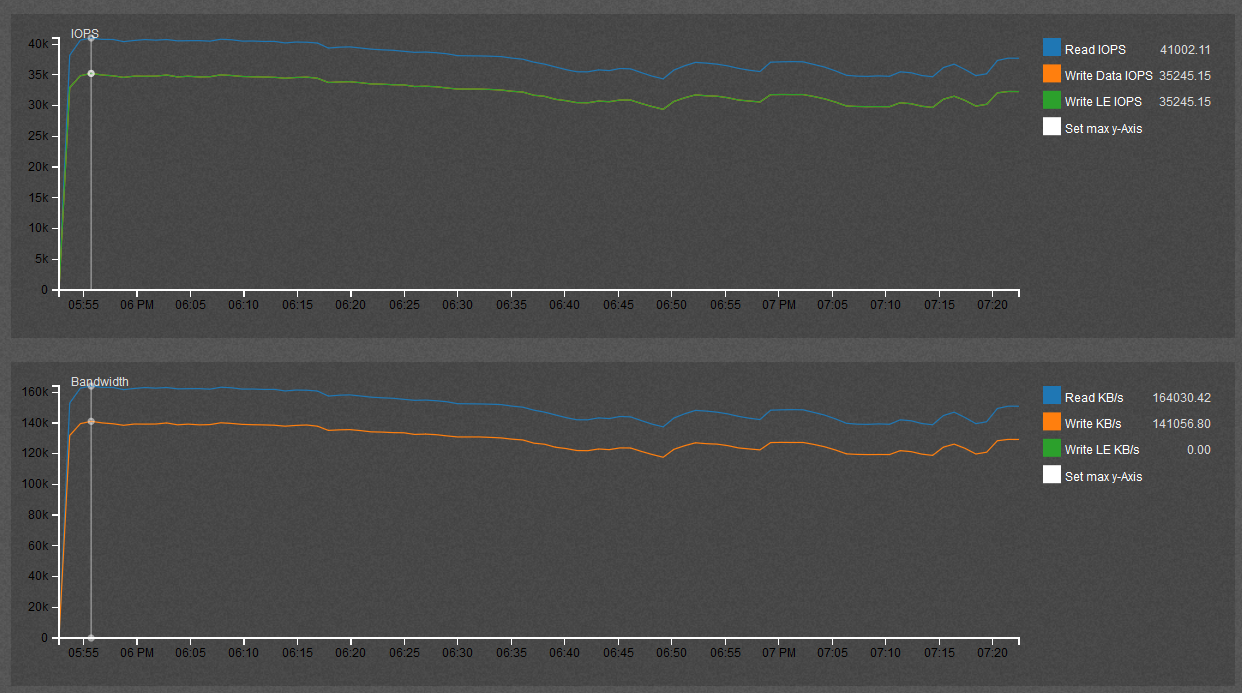
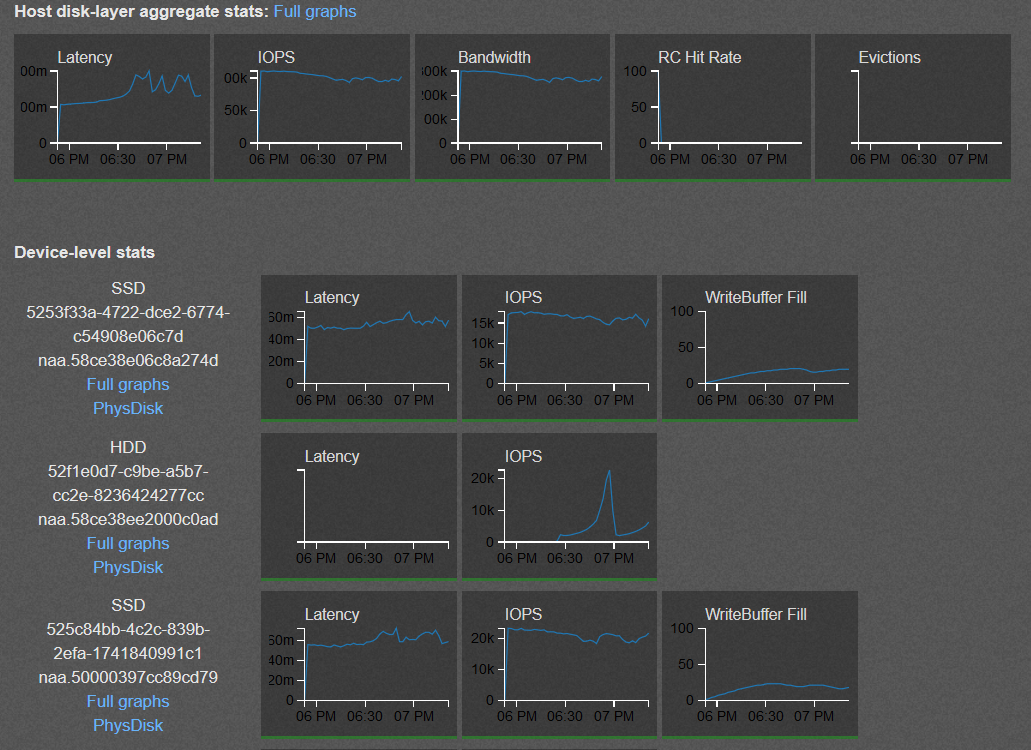

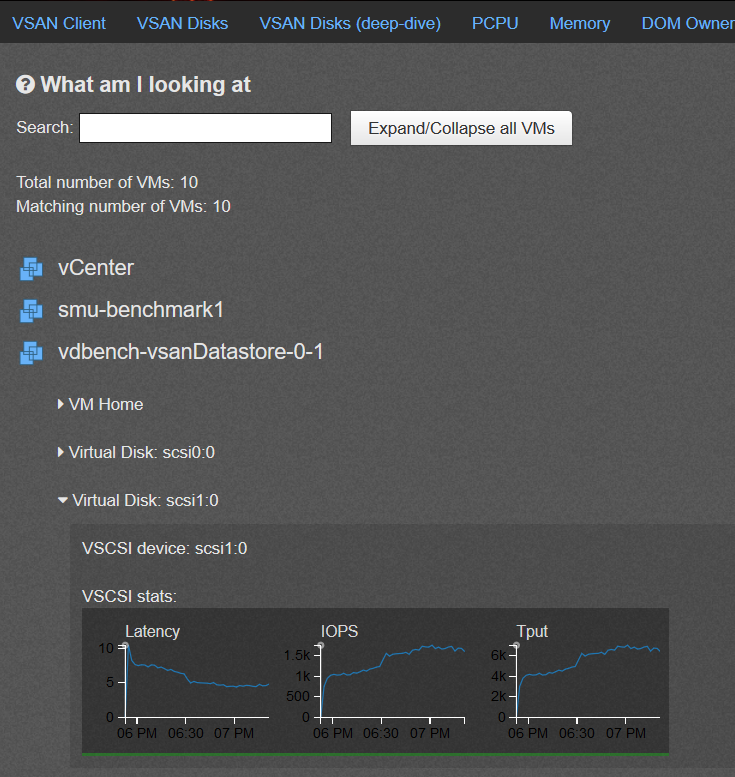
Almost in each graph section you can click and get full graphs.
Text results
Also on a web and in the .ZIP file are result in text form…
Copyright (c) 2000, 2016, Oracle and/or its affiliates. All rights reserved.
Vdbench distribution: vdbench50406 Wed July 20 15:49:52 MDT 2016
For documentation, see 'vdbench.pdf'.
16:52:41.075 Created output directory '/root/vdbench/output'
16:52:41.106 input argument scanned: '-fvdb-8vmdk-100ws-4k-70rdpct-100randompct-8threads'
16:52:41.170
16:52:41.171 Adjusted default JVM count for host=localhost from jvms=1 to jvms=8 because of iorate=max and a total of 8 sds.
16:52:41.171
16:52:41.311 Starting slave: /root/vdbench/vdbench SlaveJvm -m localhost -n localhost-10-180314-16.52.41.043 -l localhost-0 -p 5570 -d86
16:52:41.333 Starting slave: /root/vdbench/vdbench SlaveJvm -m localhost -n localhost-11-180314-16.52.41.043 -l localhost-1 -p 5570 -d86
16:52:41.363 Starting slave: /root/vdbench/vdbench SlaveJvm -m localhost -n localhost-12-180314-16.52.41.043 -l localhost-2 -p 5570 -d86
16:52:41.385 Starting slave: /root/vdbench/vdbench SlaveJvm -m localhost -n localhost-13-180314-16.52.41.043 -l localhost-3 -p 5570 -d86
16:52:41.408 Starting slave: /root/vdbench/vdbench SlaveJvm -m localhost -n localhost-14-180314-16.52.41.043 -l localhost-4 -p 5570 -d86
16:52:41.432 Starting slave: /root/vdbench/vdbench SlaveJvm -m localhost -n localhost-15-180314-16.52.41.043 -l localhost-5 -p 5570 -d86
16:52:41.470 Starting slave: /root/vdbench/vdbench SlaveJvm -m localhost -n localhost-16-180314-16.52.41.043 -l localhost-6 -p 5570 -d86
16:52:41.504 Starting slave: /root/vdbench/vdbench SlaveJvm -m localhost -n localhost-17-180314-16.52.41.043 -l localhost-7 -p 5570 -d86
16:52:42.427 All slaves are now connected
16:52:45.108 Starting RD=run1; I/O rate: Uncontrolled MAX; elapsed=3600 warmup=1800; For loops: None

Mar 14, 2018 interval i/o MB/sec bytes read resp read write resp resp queue cpu% cpu%  rate 1024**2 i/o pct time resp resp max stddev depth sys+u sys
16:52:46.275 1 8869.00 34.64 4096 70.24 3.055 2.808 3.639 312.221 12.932 27.3 22.5 4.2
16:52:47.047 2 27285.00 106.58 4096 69.45 2.133 1.826 2.830 29.948 3.173 58.3 20.5 3.5
16:52:48.077 3 29975.00 117.09 4096 70.13 2.118 1.781 2.912 46.267 3.361 63.5 13.6 2.4
16:52:49.065 4 30425.00 118.85 4096 69.48 2.089 1.716 2.938 30.170 3.152 63.6 6.4 1.1
16:52:50.068 5 31824.00 124.31 4096 70.48 2.003 1.651 2.842 59.798 3.233 63.7 3.2 0.7
16:52:51.060 6 31044.00 121.27 4096 69.51 2.048 1.700 2.840 52.844 3.213 63.5 13.5 1.8
16:52:52.066 7 33020.00 128.98 4096 70.06 1.933 1.629 2.643 26.811 2.974 63.9 5.8 1.0
16:52:53.063 8 32574.00 127.24 4096 69.99 1.954 1.629 2.713 28.718 3.070 63.7 3.7 0.7
16:52:54.057 9 32823.00 128.21 4096 69.90 1.947 1.609 2.732 23.752 3.194 63.9 3.7 0.7
16:52:55.056 10 33120.00 129.38 4096 69.56 1.926 1.599 2.673 24.818 3.125 63.8 2.6 0.7
16:52:56.051 11 32846.00 128.30 4096 69.28 1.928 1.639 2.580 24.851 2.875 63.4 3.8 1.0
16:52:57.059 12 32356.00 126.39 4096 69.44 1.976 1.672 2.669 30.840 3.177 63.8 2.6 0.3
16:52:58.080 13 34012.00 132.86 4096 69.92 1.905 1.575 2.670 28.106 3.177 64.8 2.0 0.7
16:52:59.057 14 33399.00 130.46 4096 70.01 1.877 1.570 2.594 38.115 3.134 62.6 3.6 1.6
.
.
Related parts:
HCI Bench – vSAN performance tool – Part 1: Installation
HCI Bench – vSAN performance tool – Part 2: Configuration
HCI Bench – vSAN performance tool – Part 3: Tests and Results
