Yesterday’s VMUGCZ online event delivered exactly what many VMware admins appreciate most: a practical deep dive that goes beyond the wizard.
In “vSAN File Services a little bit deeper”, Jiří Viktorin walked through how vSAN File Services works “under the hood,” what you should have ready before enabling it, and what to watch out for when moving from lab to production.
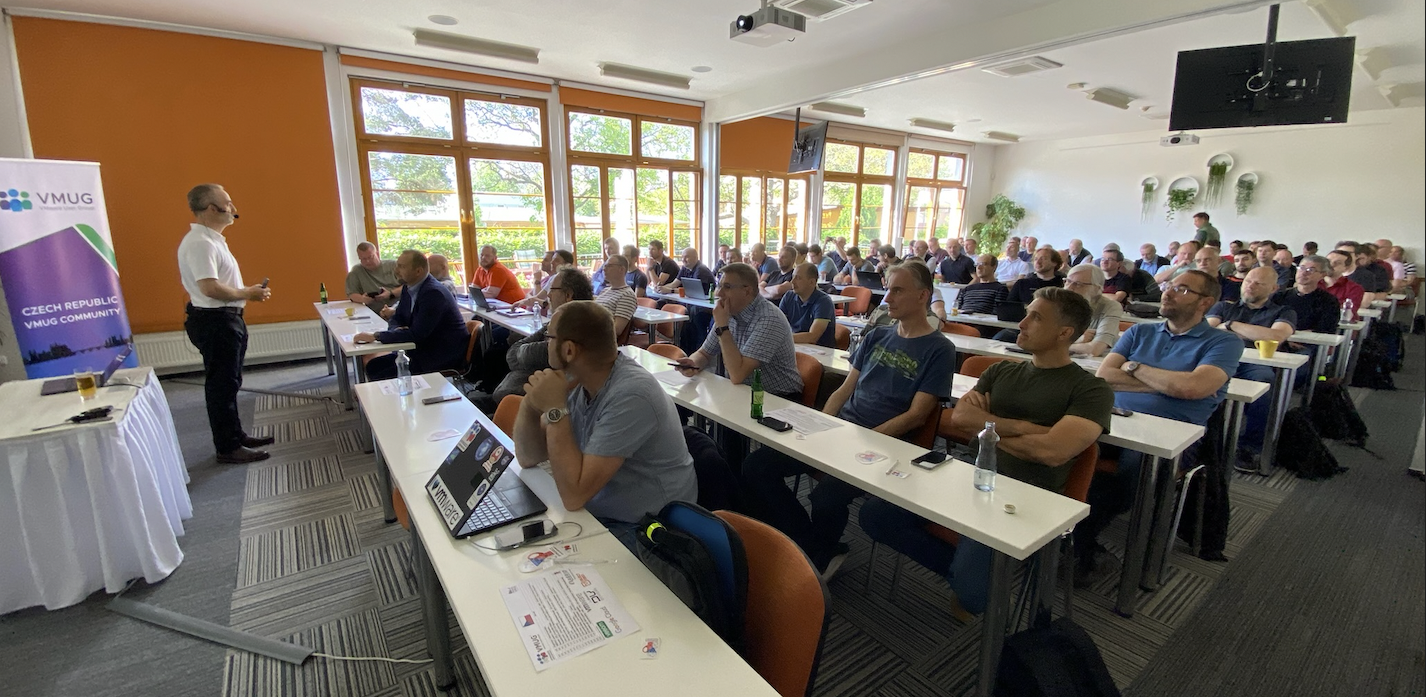
Yesterday’s VMUGCZ event in Prague was a fantastic success, bringing together professionals and enthusiasts for a day filled with insightful sessions, engaging discussions, and valuable networking opportunities.
Agenda:
Welcome by VMUGCZ Leaders The event began with a warm welcome from the VMUGCZ leaders, setting the stage for an exciting day ahead. They provided an overview of the agenda, highlighting the key topics and sessions that attendees could look forward to.
Keynote: VCF, AI, and Other Things Joe Baguley from Broadcom kicked off the keynote with a deep dive into VMware Cloud Foundation (VCF), the evolving role of AI, and other emerging technologies. His presentation was followed by a lively Q&A session led by Vlastimil Horák from VMware by Broadcom, allowing attendees to ask questions and engage directly with the experts.
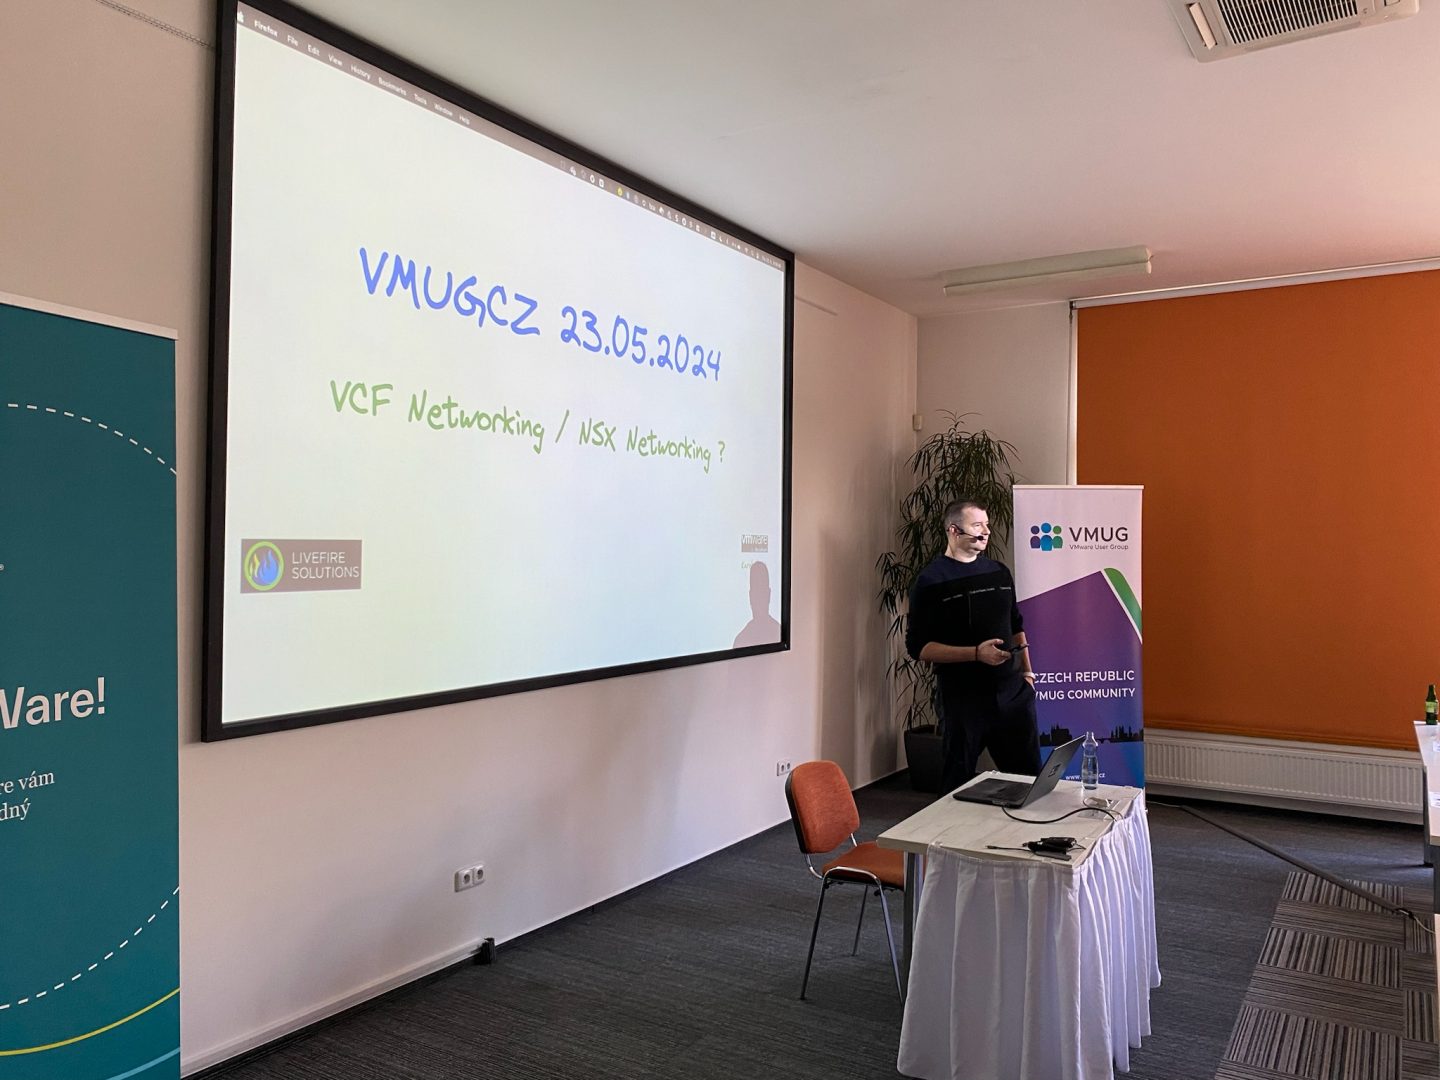
Understanding NSX in VCF: Best Practices for VCF Networking Karel Novak from VMware by Broadcom delivered a detailed session on understanding NSX within VCF. He shared best practices for optimizing VCF networking, providing practical insights and solutions for common challenges.
Coffee Break and Social Networking The first coffee break offered a chance for attendees to mingle, discuss the morning sessions, and network with peers and industry experts. It was a great opportunity to build connections and share ideas.
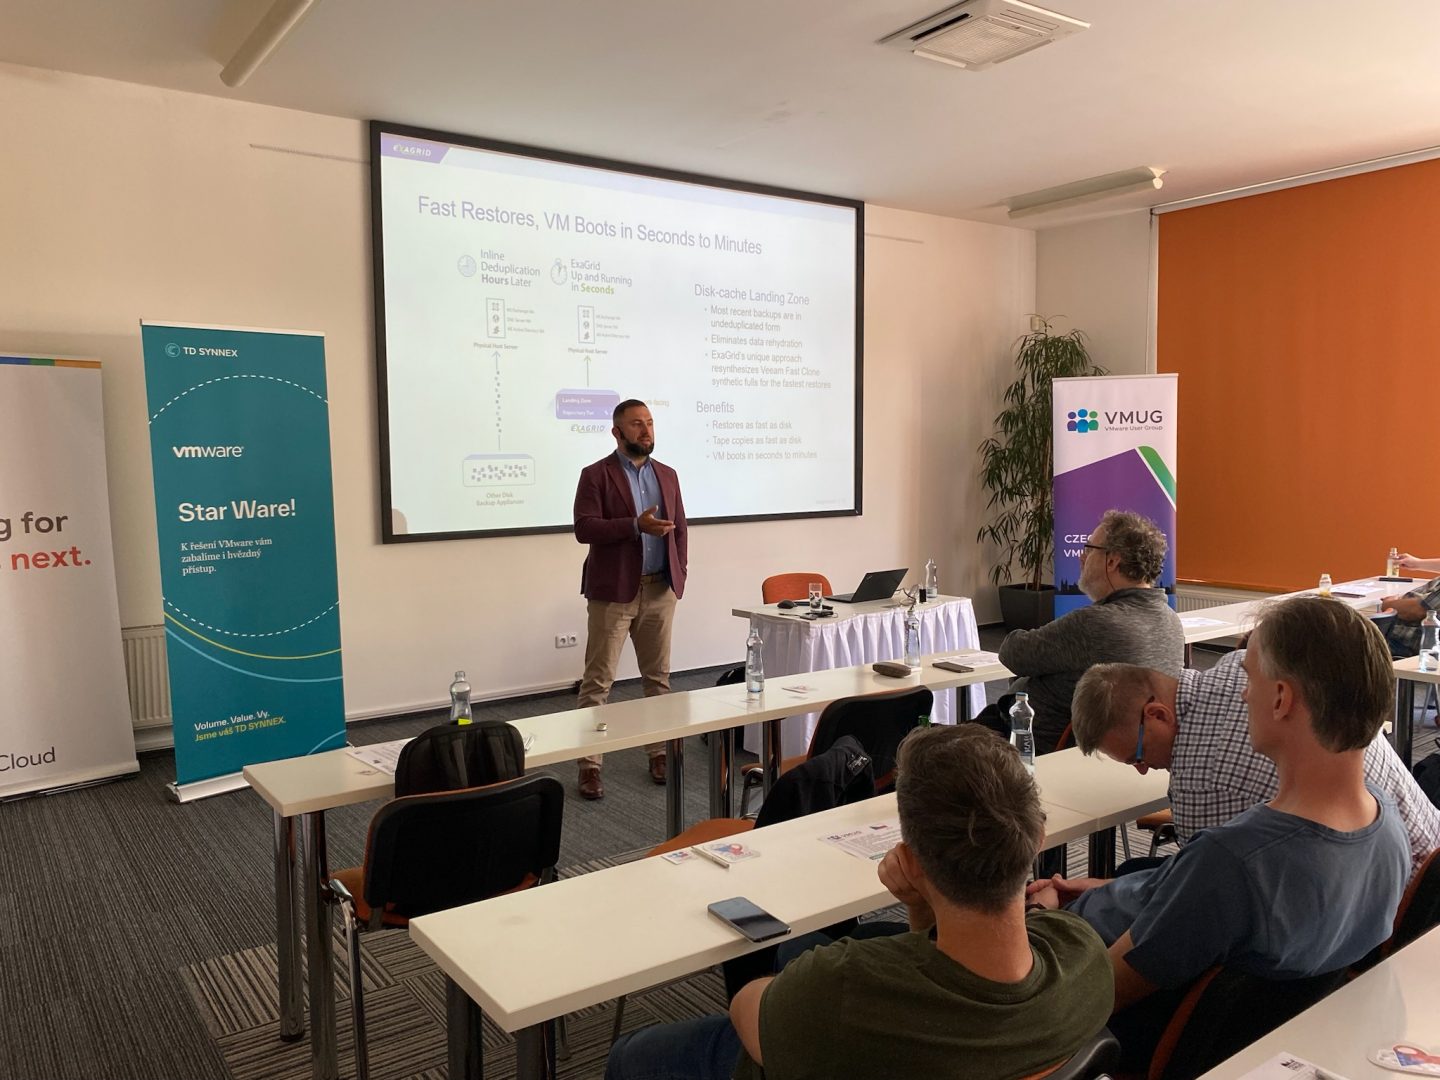
The Future is Here: ExaGrid Tiered Backup Storage Piotr Łukasiewicz from ExaGrid Systems introduced the latest innovations in tiered backup storage. His presentation highlighted the benefits of ExaGrid’s solutions, emphasizing how they can enhance data protection and recovery strategies.
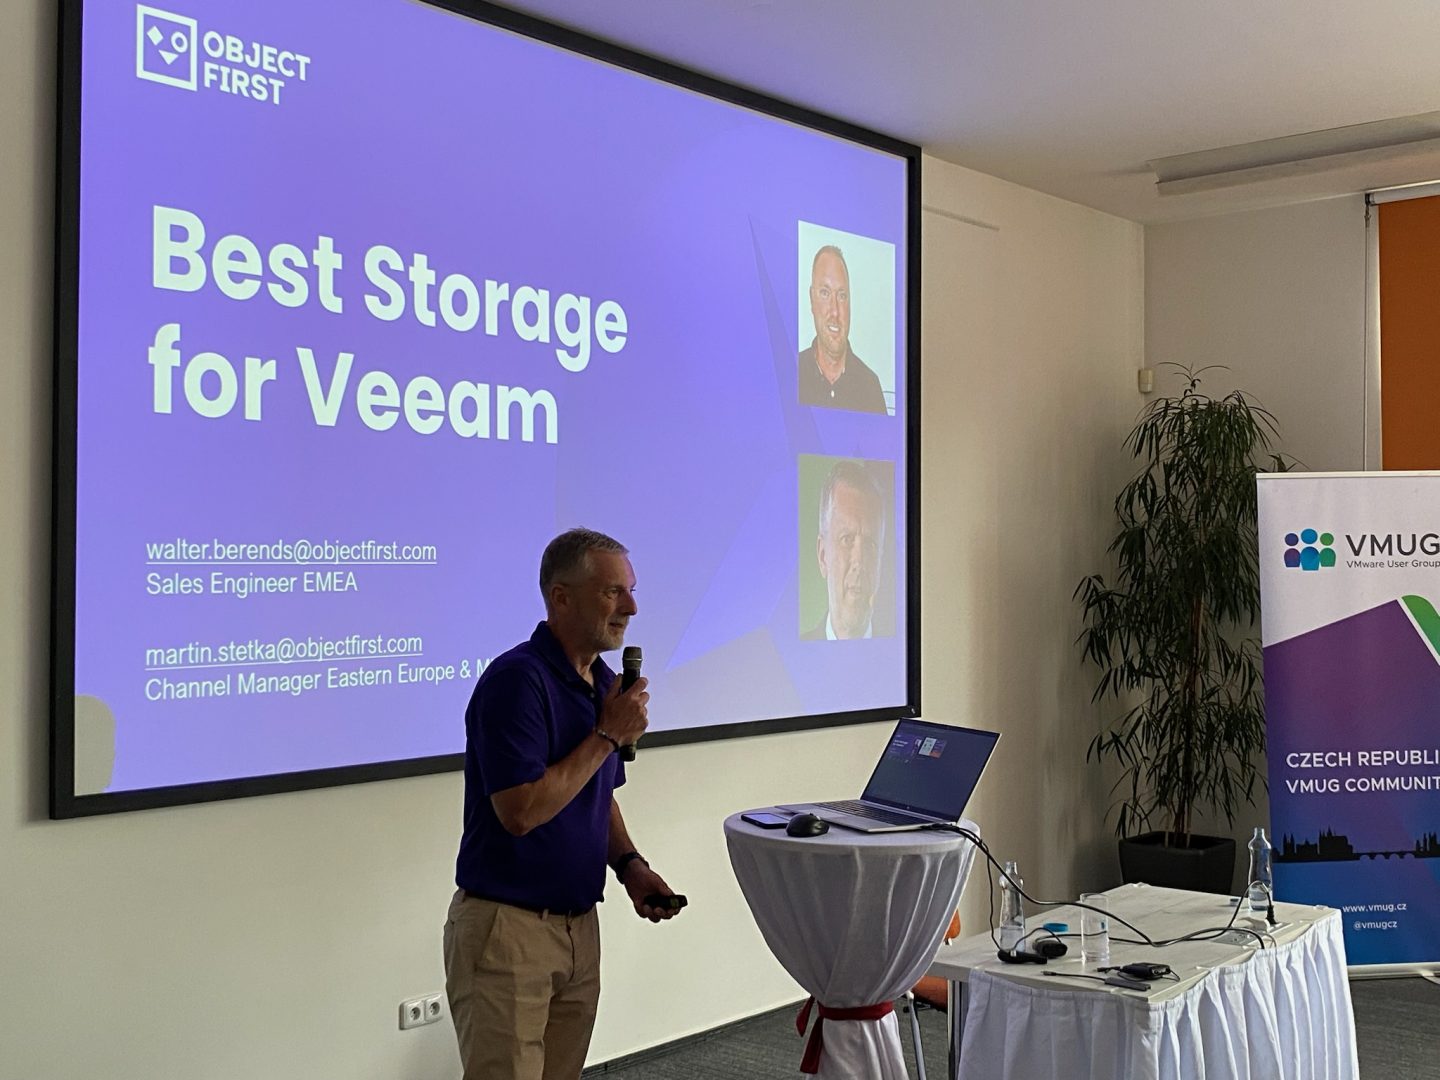
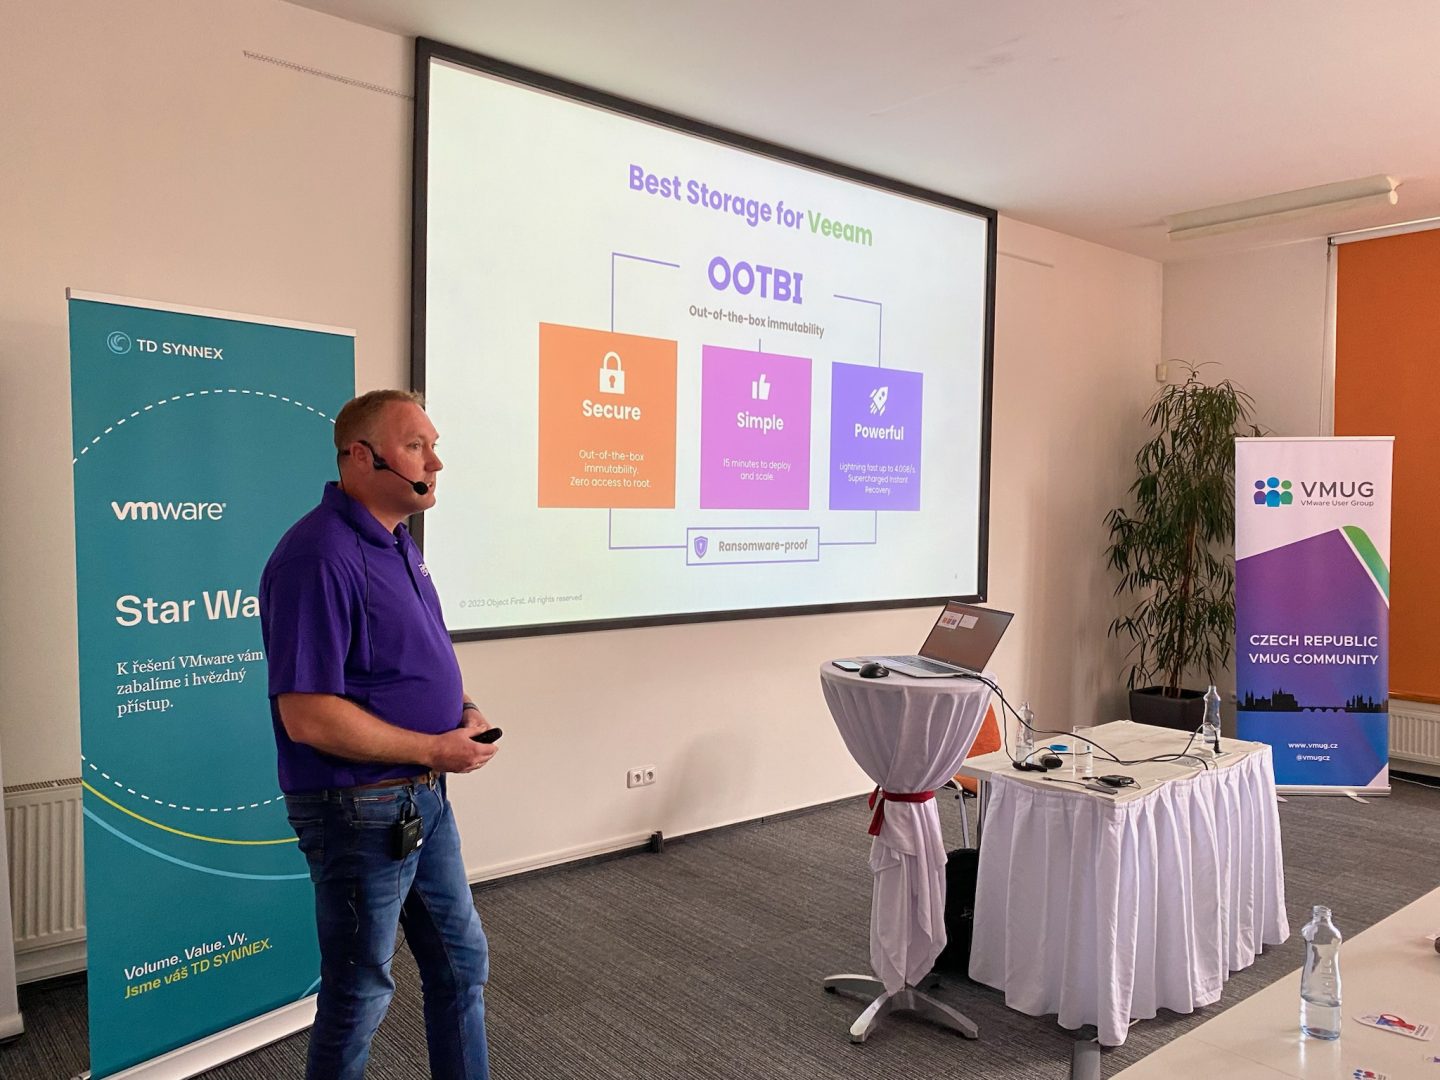
Ootbi by Object First – Best Storage for Veeam Walter Berends from ObjectFirst discussed the optimal storage solutions for Veeam, focusing on the features and advantages of Ootbi by Object First. His insights were particularly valuable for those looking to improve their data storage and management practices.
Lunch Break A delicious lunch provided a welcome break and another opportunity for attendees to network and discuss the day’s topics in a more informal setting.
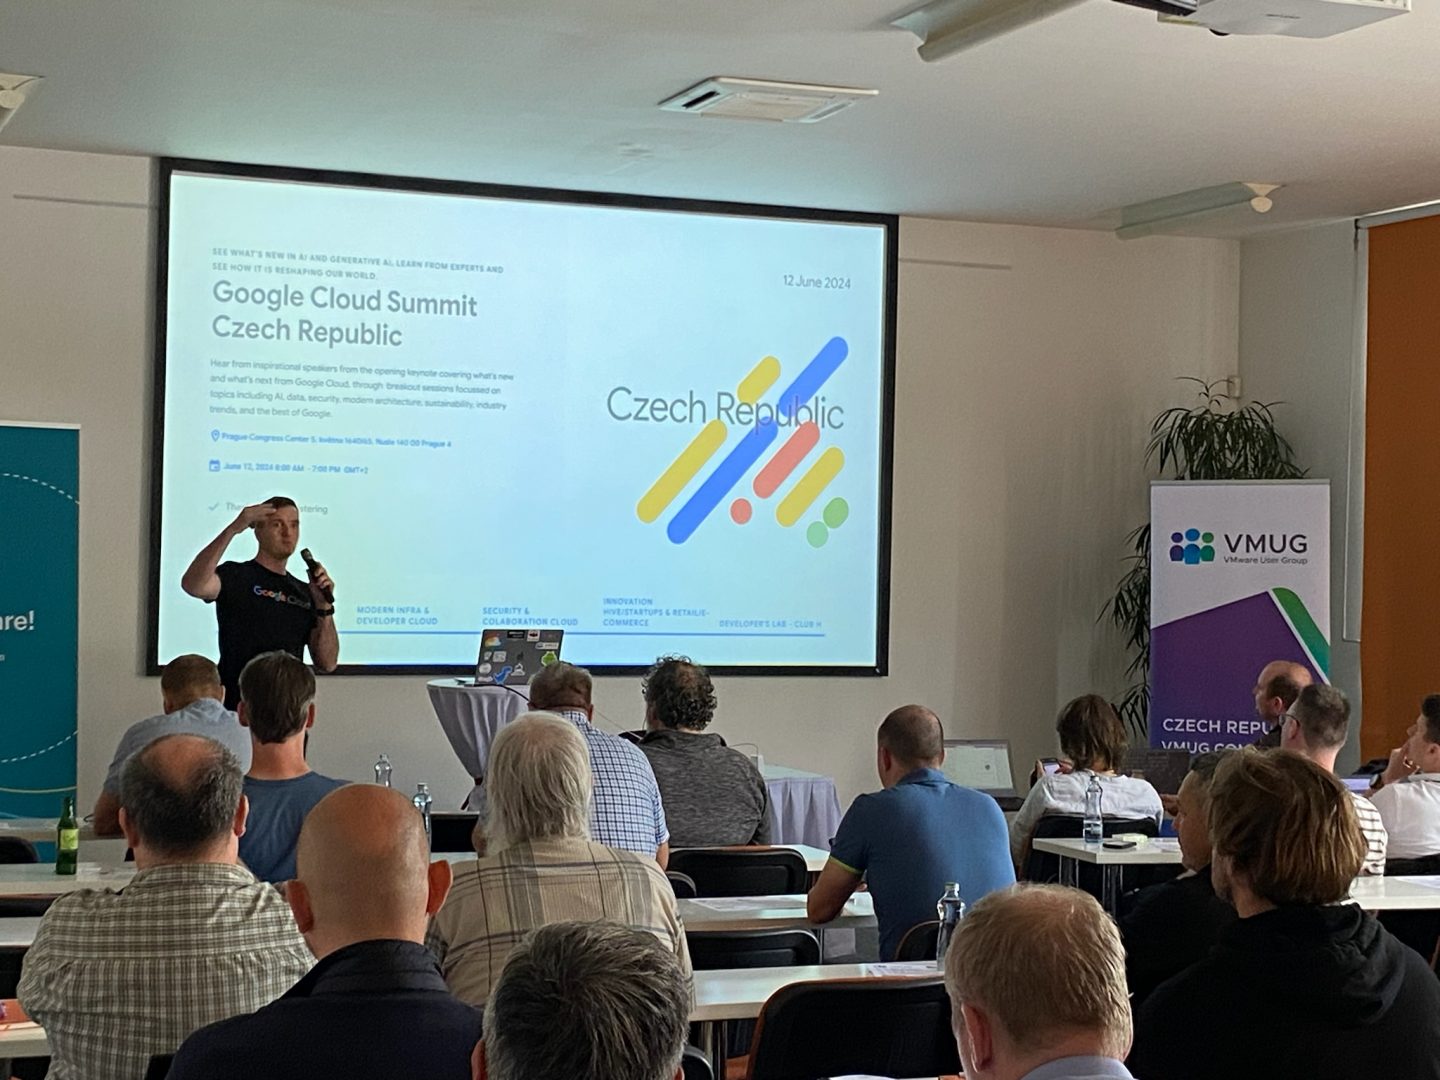
Google Cloud VMware Engine: AI-Assisted Automation for Your Workloads Agnieszka Koziorowska from Google presented on the integration of AI-assisted automation with VMware workloads on Google Cloud. Her session showcased practical applications and the significant benefits of this advanced technology.
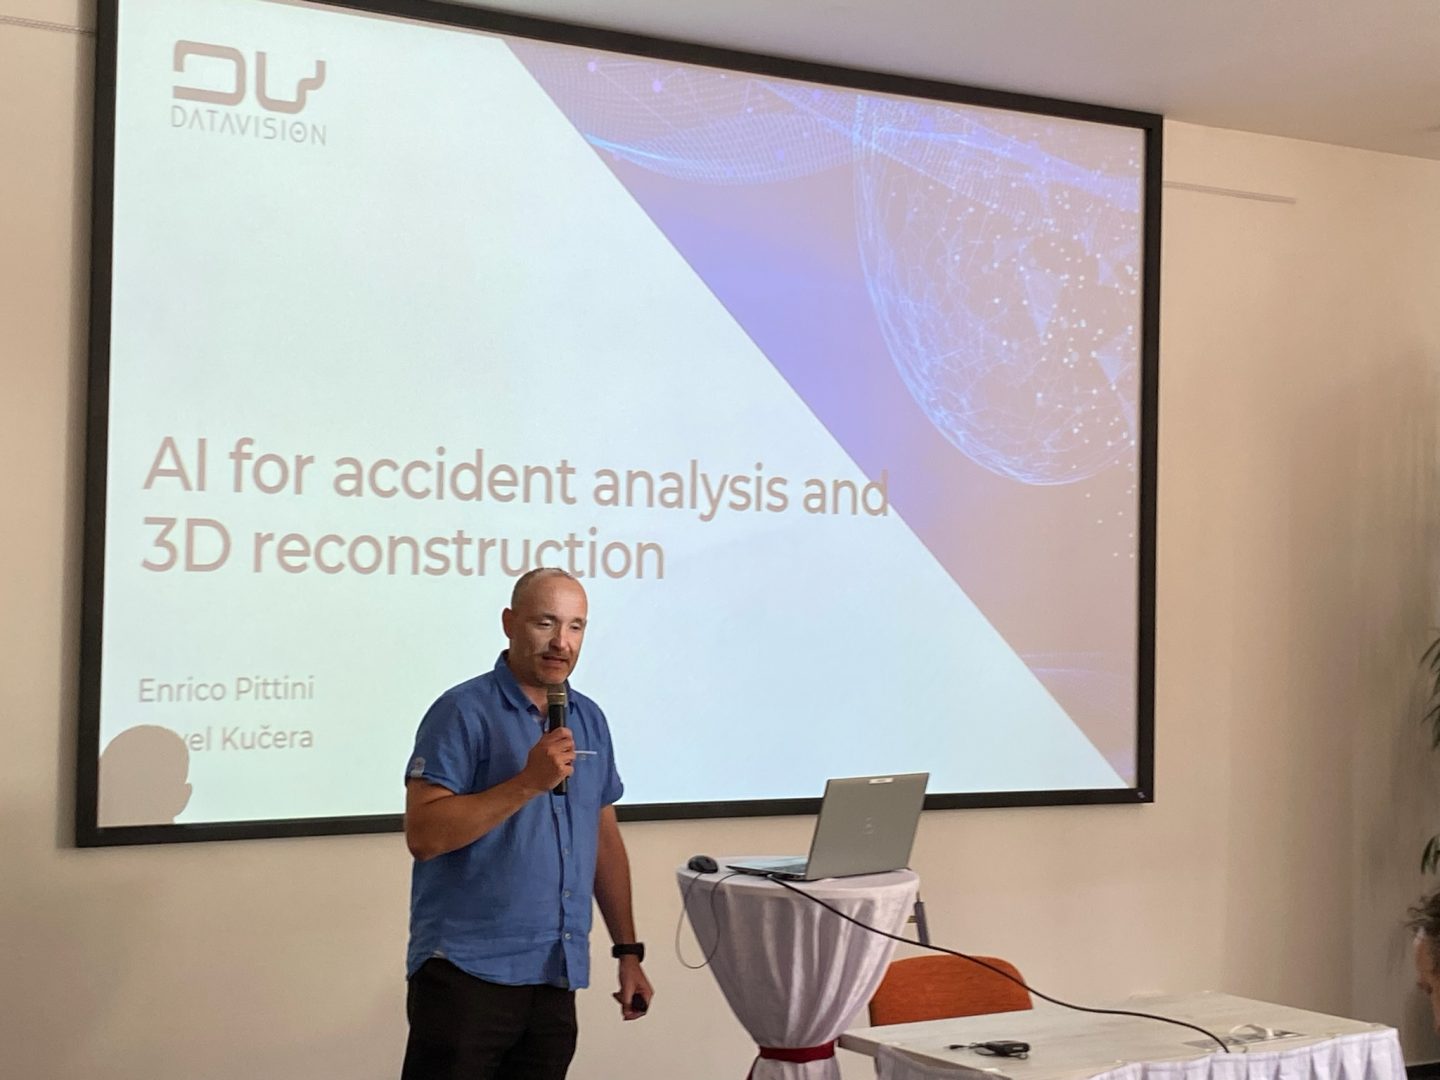
AI for Accident Analysis and 3D Reconstruction Enrico Pittini and Pavel Kučera from DataVision demonstrated the use of AI for accident analysis and 3D reconstruction. Their presentation highlighted real-world use cases and the technological advancements driving these innovations.
Coffee Break and Social Networking Another coffee break allowed attendees to relax and continue their networking conversations, exchanging thoughts on the afternoon sessions.
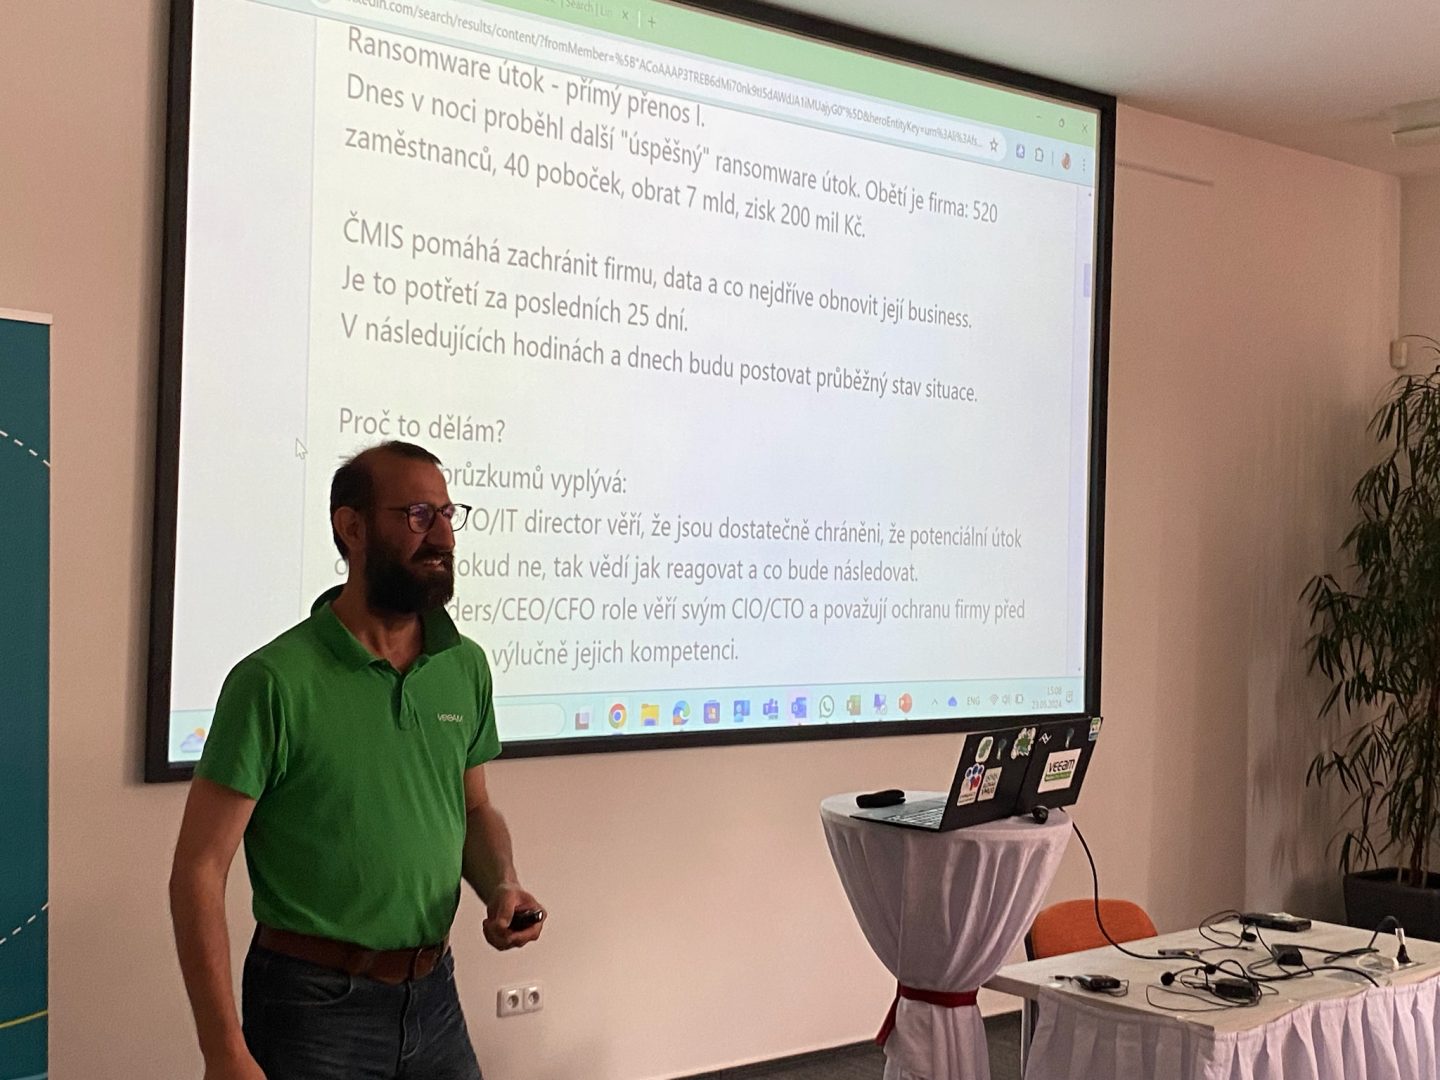
Before Calling in the Backups Boris Mittelmann from Veeam discussed the importance of preparedness in backup management. He shared strategies and best practices to ensure effective and efficient backup processes.
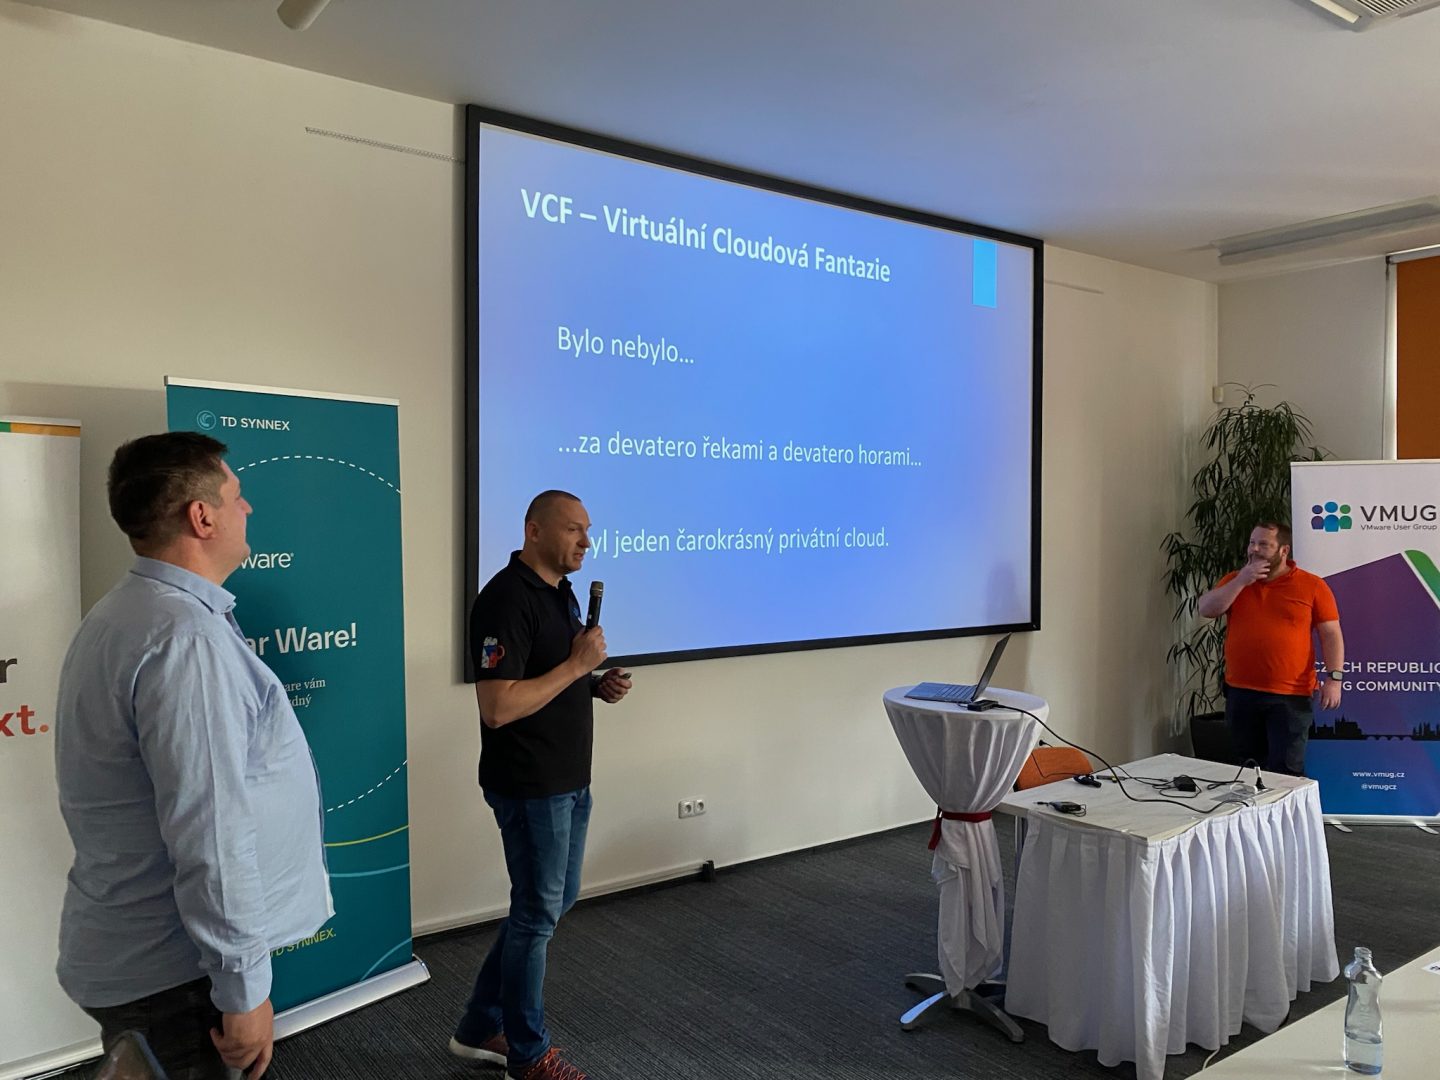
VCF aka Virtuální Cloudová Fantazie A community session led by Martin Dimitrov, Libor Junek, and Josef Zach explored the capabilities of VMware Cloud Foundation. Titled “Virtuální Cloudová Fantazie” this session provided info from real-life VCF deployment.
Roundtable with VMUG Leaders and Speakers The roundtable discussion offered an interactive platform for VMUG leaders and speakers to engage with the audience. Attendees had the chance to ask questions, share insights, and discuss various topics in an open forum.
Social Networking: Grill, Beer, and Hockey The event concluded with a relaxed social networking session featuring a grill, beer, and watching the Hockey World Championship on big screen. (Czech Republic vs. USA. [1:0] ) It was a fun and enjoyable end to a day packed with learning and networking.
Overall, the VMUGCZ event in Prague was a resounding success, offering valuable insights, practical knowledge, and plenty of opportunities for professional growth and connection. Check out some photos from the event below!
Joe Baguley (VMware by Broadcom) Keynote
Karel Novak (VMware by Broadcom)
Piotr Lukasiewicz (ExaGrid Systems)
Martin Stetka (Object First)
Walter Berends (Object First)
Google Cloud
Pavel Kučera (DataVision)
Boris Mittelman (Veeam)
Libor Junek, Josef Zach, Martin Dimitrov (community session)
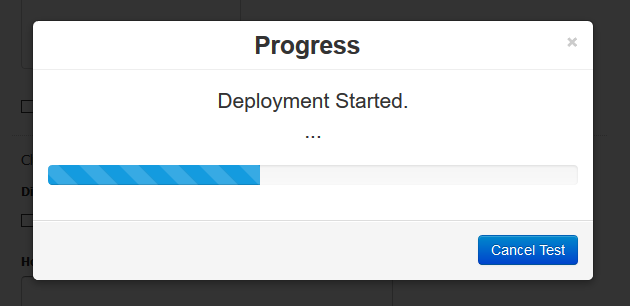
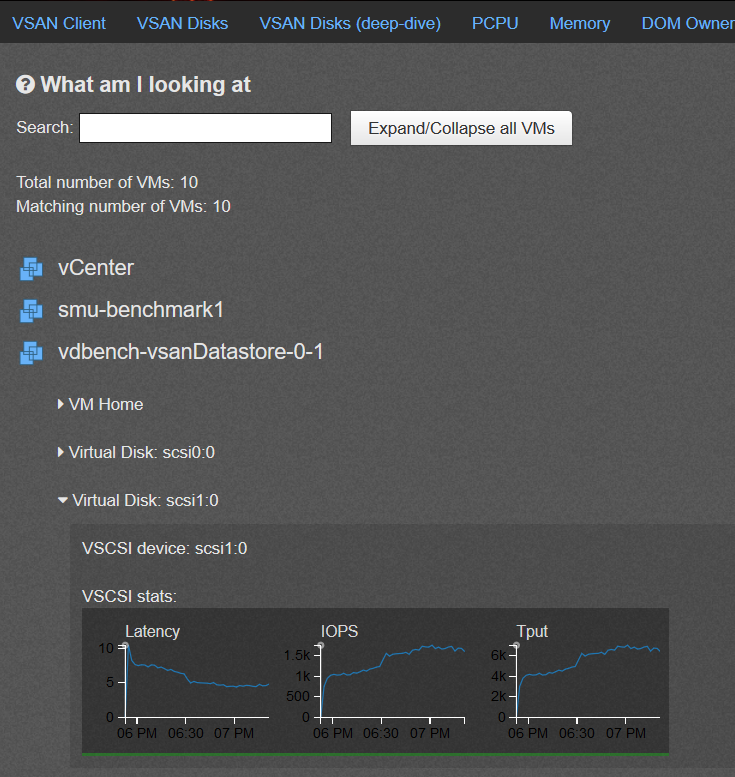
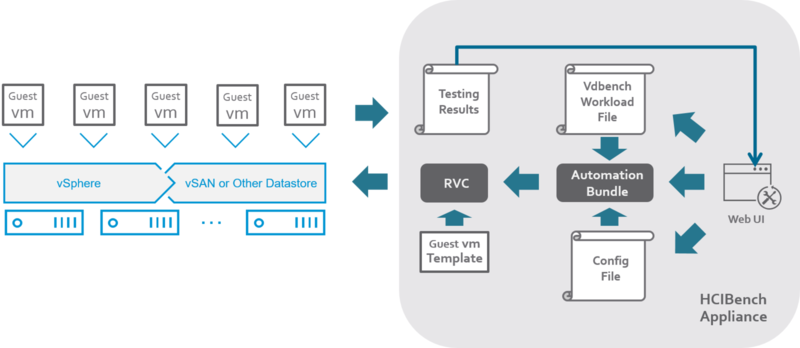
HCIBench stands for “Hyper-converged Infrastructure Benchmark”. It’s essentially an automation wrapper around the popular and proven VDbench open source benchmark tool that makes it easier to automate testing across a HCI cluster. HCIbench aims to simplify and accelerate customer POC performance testing in a consistent and controlled way. The tool fully automates the end-to-end process of deploying test VMs, coordinating workload runs, aggregating test results, and collecting necessary data for troubleshooting purposes.
HCIBench is not only a benchmark tool designed for vSAN, but also could be used to evaluate the performance of all kinds of Hyper-Converged Infrastructure Storage in vSphere environment.
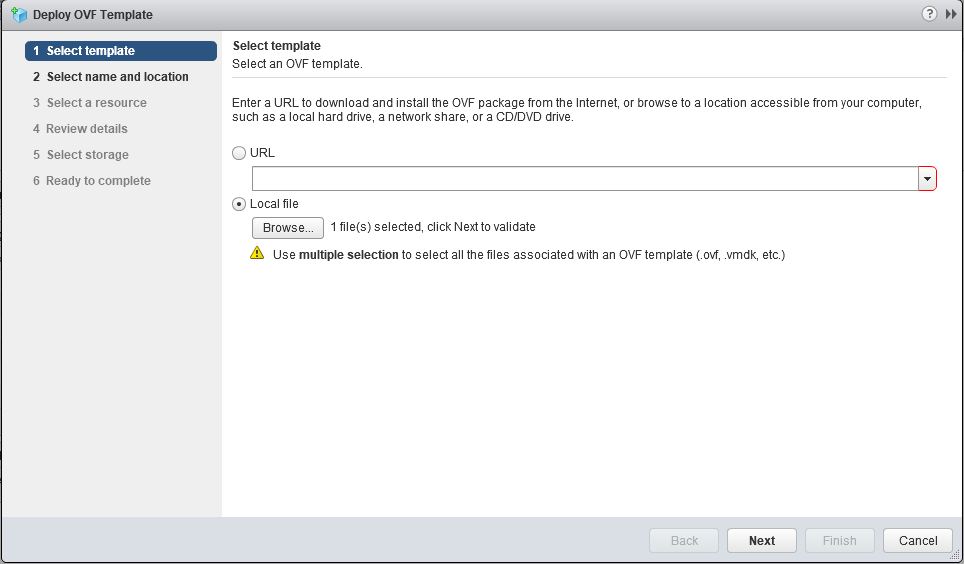
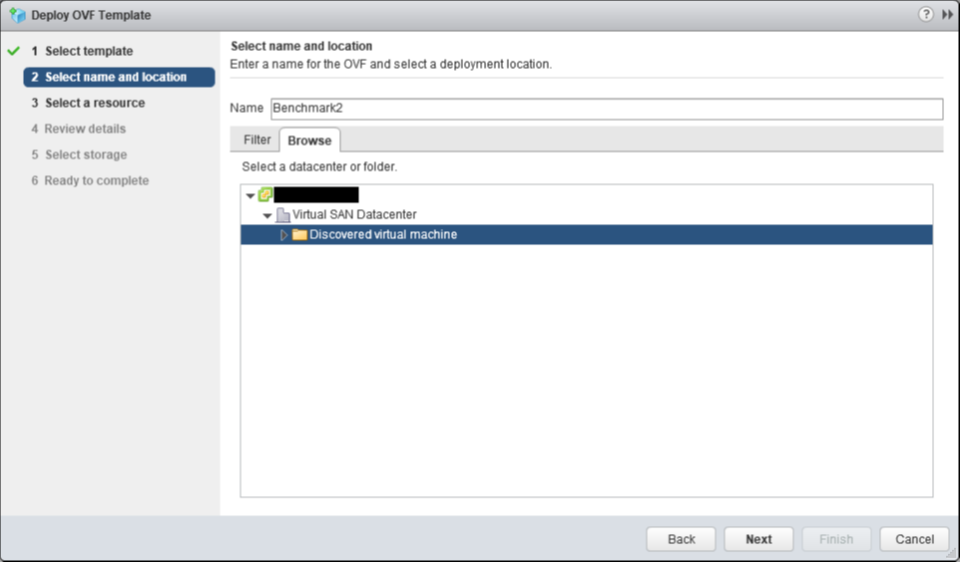
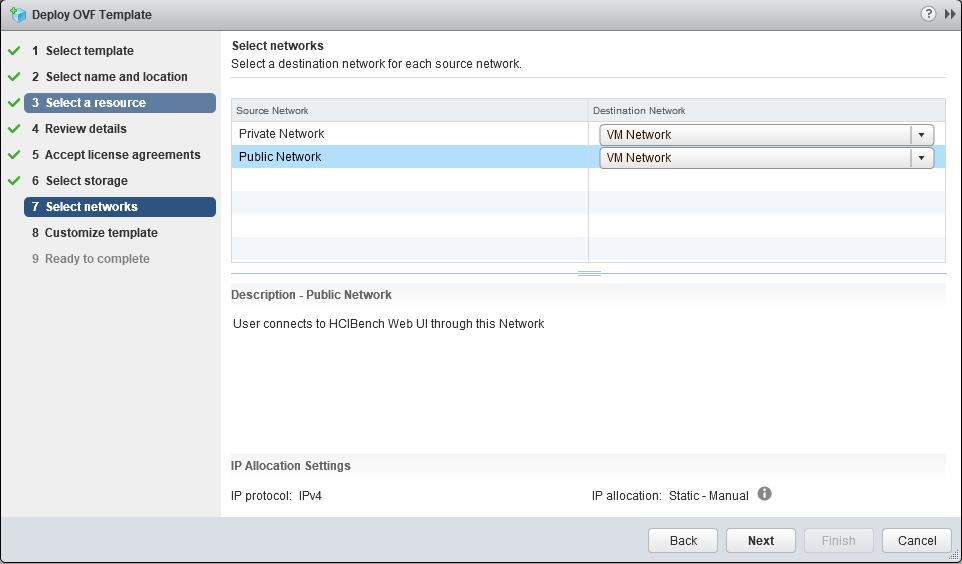
Select destination network
If there’s no DHCP Server on the VLAN which Vdbench client VMs will be deployed on, or the VLAN for Vdbench client VMs can not be routed from the Public Network, map this Network to the VLAN and Enable DHCP Service in the Web UI if needed
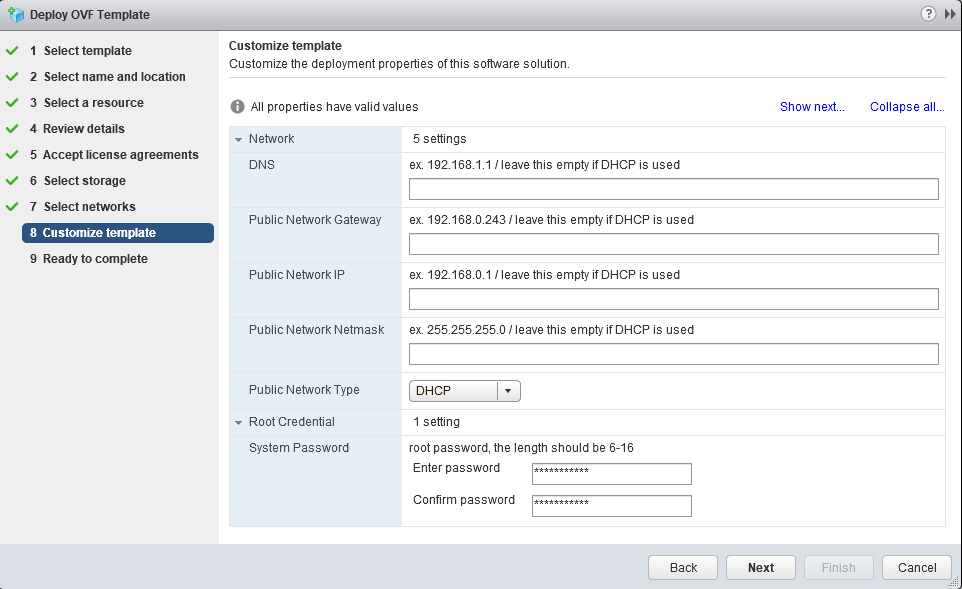
Customize the VM. As I am using DHCP in my LAB so all Network fileds are empty. And at the bottom enter your password for root.
![VMUGCZ Online Event Recap: vSAN File Services (Deeper Dive) [CZ] — Jiří Viktorin (Feb 26, 2026)](https://vpxd.dc5.cz/wp-content/uploads/2026/02/VMUGCZ-intro-video-picture-1200x675.png)